Rubyでも簡単にグラフ画像を生成したい人生だった
やりたいこと
RubyからMatplotlibのグラフ画像を生成する。
Rubyでグラフ生成ならtopfunky/gruffが有名だが、最近はあまりメンテされてる感じがないし、どうせならMatplotlibの知見を活かしたい
環境
後述するが、Pythonのインストールは若干癖があるので注意
インストール
RubyからPythonを呼び出すにはPycallというライブラリを使う そのまんま
Gemfileに以下を追加してbundle install
gem "pycall"
Python側でMatplotlibがインストールされている必要があるので、
pip install -U matplotlib
しておく
サンプル
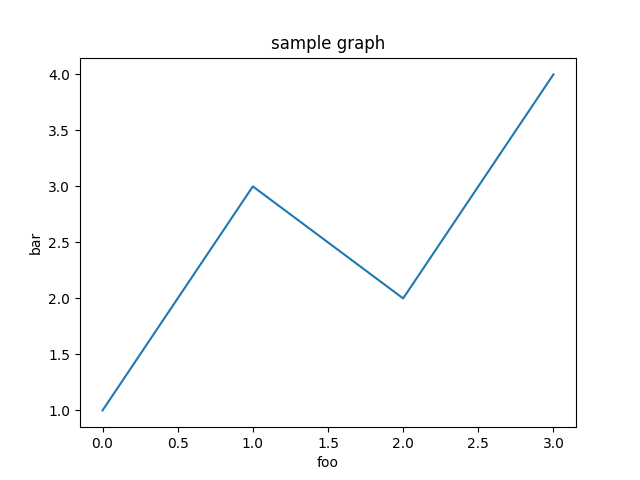
簡単な折れ線グラフを生成してみる
require 'pycall/import'
include PyCall::Import
pyimport 'matplotlib.pyplot', as: 'plt'

plt.title('sample graph')
plt.xlabel('foo')
plt.ylabel('bar')
plt.plot([1,3,2,4])
plt.savefig("graph.png")
すると以下のようなグラフができる!

エラーになるとき
ImportError
ImportError: No module named site
みたいに怒られる&pyenvでビルドしたPythonを使っていた場合はビルドのオプション「enable-shared」を有効にして再インストールする必要がある。
env PYTHON_CONFIGURE_OPTS='--enable-shared' pyenv install 3.8.0
でおk
Python is not installed as a framework
以下のようなエラー
Traceback (most recent call last):
    3: from index2.rb:19:in `<main>'
    2: from /Users/thr3a/.rbenv/versions/2.5.1/lib/ruby/gems/2.5.0/gems/pycall-1.2.1/lib/pycall/import.rb:18:in `pyimport'
    1: from /Users/thr3a/.rbenv/versions/2.5.1/lib/ruby/gems/2.5.0/gems/pycall-1.2.1/lib/pycall.rb:62:in `import_module'
/Users/thr3a/.rbenv/versions/2.5.1/lib/ruby/gems/2.5.0/gems/pycall-1.2.1/lib/pycall.rb:62:in `import_module': <class 'ImportError'>: Python is not installed as a framework. The Mac OS X backend will not be able to function correctly if Python is not installed as a framework. See the Python documentation for more information on installing Python as a framework on Mac OS X. Please either reinstall Python as a framework, or try one of the other backends. If you are using (Ana)Conda please install python.app and replace the use of 'python' with 'pythonw'. See 'Working with Matplotlib on OSX' in the Matplotlib FAQ for more information. (PyCall::PyError)
  File "/Users/thr3a/.pyenv/versions/3.6.8/lib/python3.6/site-packages/matplotlib/pyplot.py", line 2372, in <module>
    switch_backend(rcParams["backend"])
  File "/Users/thr3a/.pyenv/versions/3.6.8/lib/python3.6/site-packages/matplotlib/pyplot.py", line 207, in switch_backend
    backend_mod = importlib.import_module(backend_name)
  File "/Users/thr3a/.pyenv/versions/3.6.8/lib/python3.6/importlib/__init__.py", line 126, in import_module
    return _bootstrap._gcd_import(name[level:], package, level)
  File "/Users/thr3a/.pyenv/versions/3.6.8/lib/python3.6/site-packages/matplotlib/backends/backend_macosx.py", line 14, in <module>
    from matplotlib.backends import _macosx
これ一見Pycall側のエラーに見えるが実はMatplotlib側のエラーで、Matplotlibの設定を変更する必要がある。
設定ファイルの確認
python -c "import matplotlib;print(matplotlib.matplotlib_fname())"
で表示されたファイル matplotlibrc を開いて、
backend : macosx
を
backend : Tkagg
に変更して再実行すればおk
余談
red-data-tools/chartyというラッパーがあって、もっとイケてるグラフも簡単に生成できるらしんだが、そもそも動作しなかった。。。。 Chartyの記事書くはずだったんだけど